30 x 30 in the US
What would fully protecting 30% of our National Waters by 2030 actually look like?
Last quarter for one of my class projects I explored what it would look like if we fully protected 30% of our national waters by 2030. Now that President Biden has signed an executive order to start making progress towards this goal I wanted to share what I completed last quarter. This is by no means a recommendation, and I do not claim to be an authority on where and how we should be protecting the oceans. I do however urge us all to do our part to make sure we protect the world around us so that future generations can continue to enjoy the beauty of this planet.
This project is purely for visualizing what it would look like when we do protect 30% of our national waters. If you want to see the project in all of its glory please view it as a story map (which is how I originally made this story).
The UN has set a goal of protecting 30% of the worlds oceans by 2030 as a last ditch effort to protect the ecosystems under the sea. In agreement with this goal some members of the US government have laid out a similar goal of protecting 30% of national lands and oceans by 2030. Currently 23% of our Exclusive Economic Zone is protected to any degree. What would it look like for this to be 30% protected as highly restricted or "no take" zones?
The marine limits and boundaries of the United States are split up in to three different categories; the territorial sea, the contiguous zone and the exclusive economic zone. These zones are measured out from the official US baseline—the low-water line as marked on NOAA charts in accordance with the Law of the Sea. Often in fisheries the collective area within these three zones is called the EEZ, and that is how I will continue to refer to these waters as a whole.
The territorial seas are an area measuring 12 nautical miles from the US baseline. The United States exercises sovereignty over all of the waters, down to the seabed, and airspace included within this area.
Beyond the territorial seas is the contiguous zone. This zone extends from where the territorial seas end out to 24 nautical miles from the US baseline. Within this area the United States may enact whatever control is necessary to ensure that the customs and policies regarding immigration, fiscal management, cultural heritage and sanitary laws and regulations are being abided by.
The final component of The United States Maritime Limits is the Exclusive Economic Zone (EEZ). The EEZ extends beyond the territorial seas (overlapping the contiguous zone) up to 200 nautical miles from the baseline, or to the maritime boundary established through treaties with other nations. In the EEZ the US has sovereign rights over the exploration, utilization and conservation of resources within the ocean and into its seabed. The US also has jurisdiction over and the use of artificial islands, installations, marine research and other structures within its EEZ.
Currently there are about 1700 Marine Protected Areas (MPAs) in the United States. Many of these are smaller state-run areas along coastal states, but there are also a few in the Great Lakes. The majority of the area contained within US MPAs is among the Pacific Islands. This is in large part due to the Papahānaumokuākea Marine National Monument around the northwester Hawaiian Islands, which is the largest Marine Protected area in the world.
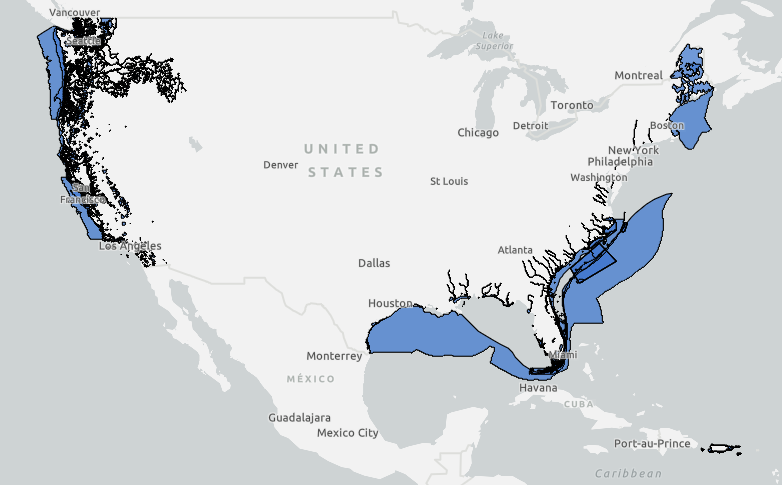
Just as these MPAs cover a wide variety of ecosystems and parts of the world they also fall under a wide range of protections. Some of these Marine Protected Areas are designated with no restrictions, while others are no-take—meaning no fishing or harvesting of any kind is permitted. In order to effectively protect our seas we not only need to designate MPAs but also ensure that these adequately protect the ecosystems and organisms within them. Currently 23% of the total US EEZ is highly protected (the first three classifications listed in the legend of the map below) with the vast majority of this protection occurring in the Pacific Islands.
Current MPAs categorized by their level of fishing restrictions. This map just goes to show the wide variety of protections afforded to Marine Protected Areas in the US.
For this Project
For this project I have focused on the national waters surrounding the contiguous United States (2,449,144 sqkm) to explore what it would look like if 30% of these waters (734,743.2 sqkm) were highly protected. I am not trying to recommend exactly where these new MPAs should be implemented, but just what it would look like if 30% of the US EEZ was protected. I looked at current MPAs that could improved their level of protection as well as where we might be able to place new MPAs based on commercial fishing vessel movement.
What would it look like if 30% of the National Waters surrounding the contiguous United States was fully or highly protected?
The first thing I did was go through the current MPAs and determine how many of them were adequately protected and which ones could feasibly improve their protection level to be highly protected. I viewed an adequate level of protection as being any MPA that prohibited commercial fishing. Some of these also prohibited recreational fishing and some didn't, but as long as commercial fishing was prohibited I considered this a highly protected MPA. By this definition there are currently 13,915 square kilometers of highly protected MPAs in the national waters of the contiguous US. This would need to be improved to 720,829 square kilometers of highly protected MPAs to reach the 30x30 goal.
Fishing effort data and commercial fishing vessel transit lines. This data was used to identify locations of high fishing intensity to avoid when strengthening the restrictions on current MPAs and developing new MPAs.
To determine which current MPAs could be improved and where new MPAs could be developed to reach this goal of having 30% of our waters protected by 2030 I looked at fishing effort data and fishing vessel transit data for the national waters of the United States. In order to use the fishing effort data to look at hotspots of fishing effort I merged three separate fishing point datasets in QGIS and then converted this merged dataset into a raster file so that I could view the density of the data to go along with the vessel transit data. I could then look at both of these datasets to identify locations to avoid when strengthening the restrictions in current MPAs as well as when creating new ones. In the end there were only five of the current MPAs that I kept with less strict restrictions due to their proximity to high levels of vessel traffic.
Critical habitat data I used to identify important areas to protect. This dataset contains critical habitat for corals, grouper, dolphinfish, lobster, sea turtles and more.
To supplement the fishing data which showed me areas to avoid when making new MPAs, I found some data on critical habitats for species such as lobster, dolphinfish and corals to inform key places where I should aim to have more protected area. Using these two types of data I was able to lay out what it might look like if we were to protect 30% of our national waters around the contiguous United States by 2030 and compare that with what we have protected now.
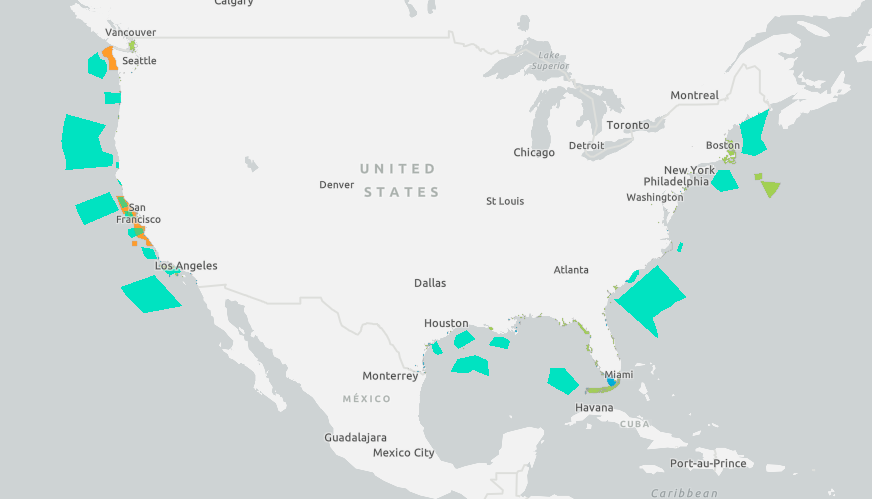
What it would look like if 30% of the United States national waters were to be highly protected in 2030.
Looking at what having 30% of the National Waters of the Contiguous United States protect would look like provides valuable context for the 30x30 resolution. While this is a significant amount of ocean it doesn't need to have a significant negative impact on fishing efforts or our economic benefits from the oceans. In fact, having more MPAs that are strategically placed may actually improve fishing yields by providing locations for the stock to recover and grow without fishing interference.
Upon looking at this final map it is easy to see how 30% is a significant amount of protected water, but it is also apparent that it would maintain a good amount of water available for fishing. Though it would require lots of governmental support and cooperation and many meetings conversations with local people, stakeholders and experts we can protect 30% of our oceans by 2030. It is important for us to reach this goal and have a map that looks similar in the amount of area that is protected as the one that I have developed here and I believe this is a feasible goal if local people, scientists and government officials all work together to protect the oceans for generations to come.
Please check out the story map that I made for a better look at the maps in this blog post.
Sources
30 x 30 » Marine Conservation Institute. (2020). Marine Conservation Institute. https://marine-conservation.org/30x30/
Cooney, M., Goldstein, M., & Shapiro, E. (2019, June 3). How Marine Protected Areas Help Fisheries and Ocean Ecosystems. Center for American Progress. https://www.americanprogress.org/issues/green/reports/2019/06/03/470585/marine-protected-areas-help-fisheries-ocean-ecosystems/
THE 17 GOALS | Sustainable Development. (n.d.). Retrieved November 19, 2020, from https://sdgs.un.org/goals
The Goal. (n.d.). American Nature Campaign. Retrieved October 8, 2020, from https://www.natureamerica.org/why-30x30
United States Marine Protection. (n.d.). Retrieved November 18, 2020, from https://mpatlas.org/countries/USA*
United States (national waters) Marine Protection. (2020, November 5). https://mpatlas.org/countries/USA
US Department of Commerce, N. O. and A. A. (2020, April 23). Where are marine protected areas located? https://oceanservice.noaa.gov/facts/mpaloc.html
U.S. Maritime Limits & Boundaries. (2020, June 8). https://nauticalcharts.noaa.gov/data/us-maritime-limits-and-boundaries.html#general-information
Data Sources
Fishing Effort: To put together my fishing effort raster dataset I combined three fishing datasets from the Global Fish Watch and the NOAA FRAM data warehouse (from which I used the Trawl Survey and the Hook & Line Survey).
Fishing Vessel Transit: The commercial fishing vessel transit data I use the "2016 Vessel Transit Counts Fishing" from Marine Cadastre.
Critical Habitat: The critical habitat data I gathered by combining a few datasets from Marine Cadastre ("Coastal Critical Habitat Designations") and from the Florida Fish and Wildlife Conservation Commission.
MPA Outlines: I got the data for the current MPAs from NOAA.
Marine Boundaries: I digitized the EEZ polygons in the first few maps using the outlines of the US marine limits and boundaries from Data.gov.


